Rate Change – FY’s 2024 and 2025
New Braunfels Utilities will enter the second year of its City Council-approved two-year rate plan for Fiscal Years 2024 and 2025 on August 1, 2024. The rate plan will help fund the costs of the 161 capital improvement projects currently in design or in progress for FY’s 2024-2028, enabling NBU to continue reliably serving essential services to our growing community.
As a nonprofit entity, New Braunfels Utilities’ rates are designed to solely cover the cost of providing essential services and upgrading and expanding existing infrastructure to support the needs of our community.
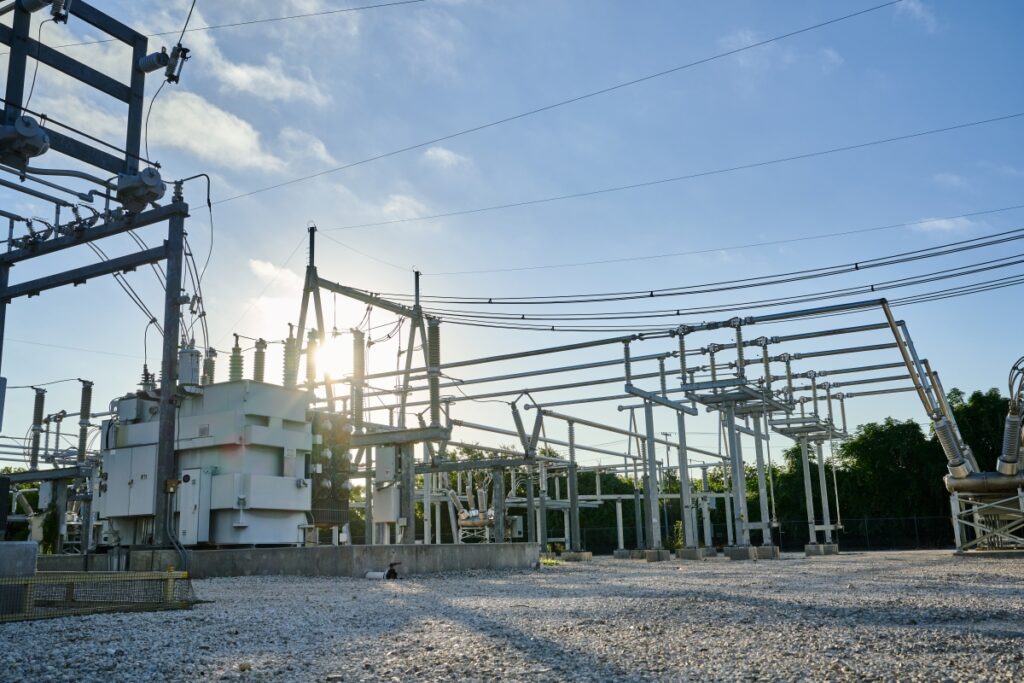
Electric
The electric rate design provides for the electric utility’s revenue sufficiency, rate-setting equity, and financial stability and strength, reducing the debt needed to cover costs and ensuring flexibility.
Overall, electric rates will increase by an average of 4.8% in FY 2024 and 5.9% in FY 2025. These amounts are driven primarily by the costs of building and maintaining electric infrastructure to meet electric consumption needs. Capital needs for infrastructure are the most significant driver at 67%, with personnel and operating and maintenance expenses driving the remaining 33%.
On April 10, 2023, the New Braunfels City Council adopted Ordinance No. 2023-416, establishing electric rates and charges for Fiscal Year 2024 beginning on August 1, 2023, and Fiscal Year 2025 beginning on August 1, 2024. As required by Texas Utilities Code Section 33.103, this report states the effect of the ordinance on each class of ratepayer.
| Customer Class | Average Bill Increase (FY 2023 to FY2024) | Average Bill Increase (FY 2024 to FY2025) |
|---|---|---|
| Residential | 6.3% | 6.5% |
| Small General Service | 6.7% | 6.7% |
| Large General Service | 7.3% | 8.6% |
| Very Large Power | 5.7% | 7.3% |
| Second Feeder Service | 39.0% | 29.2% |
| Lighting Athletic Fields | 17.9% | 15.4% |
| Interstate Highway Lighting | 0.0% | 0.0% |
| Area Lighting | 0.0% | 0.0% |
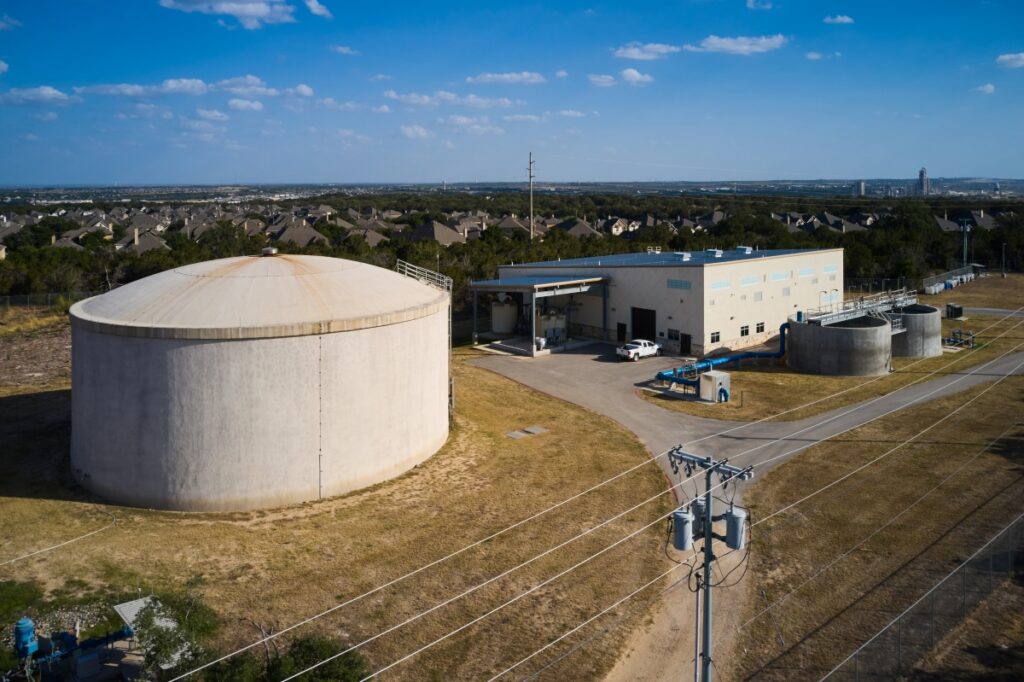
Water
The NBU system’s water infrastructure remains our most significant and costly community investment, and the approved water rate design includes the most significant changes. The two-year rate plan removes the current peak/off-peak season monthly charge distinctions from water rates to simplify the rate structure. The water volume charge usage tiers have been modified for residential, small general service, and irrigation to more appropriately match the usage levels of the customers in each class.
Water rates will increase by an average of 9.1% for FY 2024 and 13.4% for FY 2025. These changes are driven primarily by the costs to put acquired water supply into service and build infrastructure to keep up with growth and meet regulatory requirements. Capital needs for infrastructure are the most significant driver at 84%, with personnel and operating and maintenance expenses driving the remaining 16%.
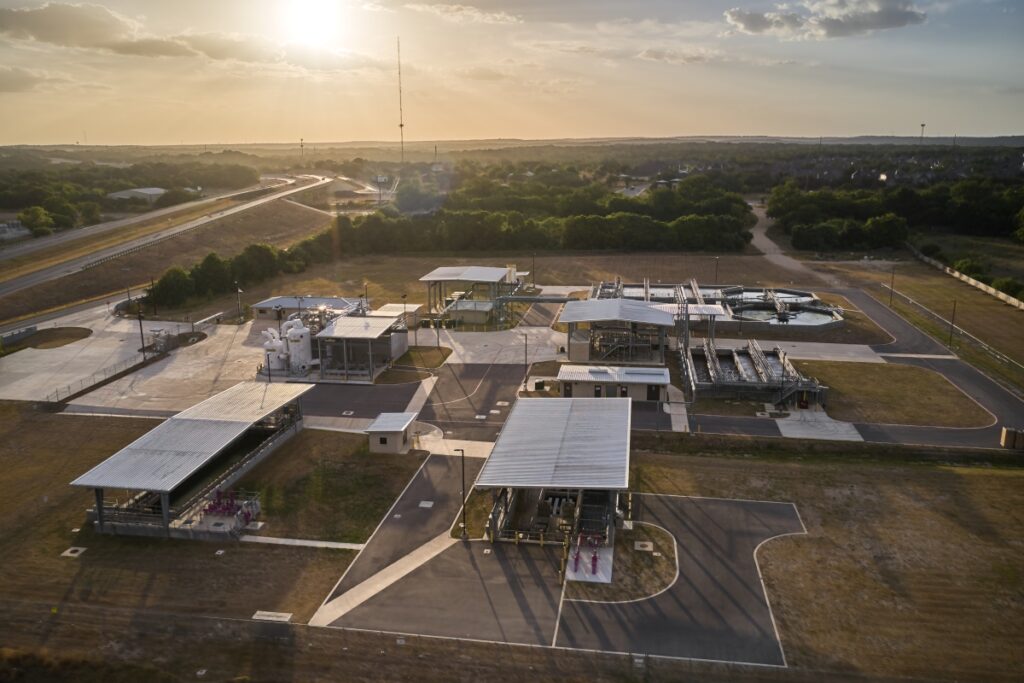
Wastewater
The wastewater rate design was closely aligned with the cost of service analysis and includes increases in FY 2024 and 2025. The two-year rate plan reflects the need to recover sufficient costs to continue operating the system and meeting regulatory requirements.
Wastewater rates will increase by an average of 7.3% for FY 2024 and 7.3% for FY 2025. These amounts are driven primarily by the need to build and maintain infrastructure to meet regulatory requirements. Like NBU’s water line of business, the primary driver for additional revenue is capital at 87%, with operating and maintenance and personnel driving the remaining 13%.
Rate Increase: Q&A
In February 2022, the NBU Board of Trustees approved the commencement of a comprehensive rate study, including a cost of service analysis, to forecast the revenue requirements needed to maintain NBU’s systems. This work was completed to assist NBU in developing a two-year rate plan for FY’s 2024 and 2025. The revenue requirements identified were driven primarily from the need for NBU to build and maintain infrastructure to keep up with growth and meet regulatory requirements.
In April 2022, the NBU Board approved the establishment of the Rate Advisory Committee, approving the RAC Bylaws, and appointing eighteen RAC members. The RAC was established to assist NBU in making rate recommendations and providing community feedback to the utility. The RAC held nine public meetings and a public rates forum to provide the opportunity for input and insight from the community on NBU’s rate plan.
The backside of the NBU bill details the line items included in the total bill for electric, water, and wastewater charges.
For the electric portion of the bill, the rate adjustments impact the Delivery Charge and Electric Service Availability Charge under the Distribution line item. The Delivery Charge is the cost of power distribution, and it is charged on a per kilowatt-hour rate. This covers the operation and maintenance of NBU’s local distribution infrastructure including poles, wires, and transformers. The Electric Service Availability Charge reflects the base costs incurred in making service available to customers, including meter reading, billing, and record keeping. This charge is fixed and independent of the amount of electricity used in a particular month.
For the water portion of the bill, the rate adjustments impact the Water Usage, Water Service Availability Charge, and Water Supply Fee line items. The Water Usage is the amount of water that was used during the billing period. This usage is billed according to the tiered rate schedule. The Water Service Availability Charge reflects the base costs incurred in making service available to customers, including meter reading, billing, and record keeping. This charge is a fixed monthly fee and is not based on usage. The Water Supply Fee is a cost assessed to customers who have a volumetric usage. This fee consists of the cost of certain water supplies expressed as dollars-per-thousand-gallons, multiplied by the gallons sold during a billing period.
For the wastewater portion of the bill, the rate adjustments will impact the Wastewater and Wastewater Service Availability Charge line items. The Wastewater line item is calculated by averaging the water consumption on the account for the lowest three months during the preceding 12-month period, and multiplying it by the current rate schedule. The Wastewater Service Availability Charge reflects the base costs incurred in making service available to customers, including meter reading, billing, and record keeping. This charge is a fixed monthly fee and is not based on usage.
The NBU bill has been updated to reallocate the previous Power Cost Recovery Adjustment (PCRA) line item into three separate line items (Generation, Transmission, and Replenish Reserves).
The Generation line item reflects the pass-through amount of the cost of power, and it is calculated using a per kilowatt-hour rate. Rather than owning power plants, NBU buys power from the ERCOT market through a hedging program, which is designed to reduce volatility and deliver a competitive price. NBU charges exactly what it pays for electricity per kilowatt-hour and the amount varies based on market conditions.
The Transmission line item is the cost of transporting energy to the NBU service territory, and is charged on a per kilowatt-hour rate. Transmission costs are set by the state each year and are based on a community’s peak electricity demand from the prior year.
The Replenish Reserves line item is a charge designed to replenish NBU’s reserves to ensure that NBU is prepared in the case of emergency events, such as Winter Storm Uri.
In 1999, when the Texas energy market was deregulated, municipalities were given the option to opt-in to deregulation. At the time, the New Braunfels City Council decided not to opt-in to deregulation.
Choosing to deregulate electric services is an irrevocable decision. If NBU opted-in to competition, then NBU would likely begin serving as a transmission and distribution utility (TDU). Current NBU customers would select a retail electric provider (REP) to sell electricity to them. A REP buys wholesale generation of electricity and would also pay a TDU, like NBU, for transmission and distribution charges for the use of NBU’s poles and infrastructure. Neither the NBU Board of Trustees nor the New Braunfels City
Council will have authority over the rates that customers pay once NBU opts into competition.
As a municipality that provides retail water and sewer service, NBU is required to have a Certificate of Convenience and Necessity (CCN). A CCN gives the utility exclusive rights to provide water and sewer service to the identified geographical area. All CCN holders are required by Chapter 13 of the Texas Water Code to provide continuous and adequate service to their boundary.
To view NBU’s service area, click here.
As a nonprofit entity, NBU’s rates are designed to cover the cost of providing essential services and upgrading existing infrastructure. NBU’s five-year capital plan includes the investment of $980 million into 161 capital improvement projects over the next five years.
As our service area grows, these projects support our mission of enhancing the quality of our community by providing innovative essential services.
New Braunfels Utilities offsets the impact of growth on water and wastewater rates through impact fees. Impact fees are paid by developers and are authorized under Chapter 395 of the Texas Local Government Code.
An impact fee is a charge or assessment imposed on a new development in order to generate revenue for funding or recouping the costs of capital improvements or facility expansions necessitated by and attributable to the new development. Impact fees help fund and pay for the construction or needed expansion of capital improvements that are necessary to serve the new development. These fees are implemented to help reduce the economic burden on existing rate payers.
NBU’s previous impact fee program update was approved by City Council on August 13, 2018, with an effective date of November 13, 2018. Chapter 395 of the Texas Local Government Code requires a governmental body that has previously adopted an impact fee to update its land use assumptions and capital improvements plan at least every five years. On November 14, 2022, the New Braunfels City Council approved the updated maximum allowable impact fees for water and wastewater, with an effective date of February 1, 2023.
New Braunfels Utilities recognizes that utility bills may continue to be a challenge for customers in the face of global energy market volatility, the heat wave and drought, and other widespread factors. We want to be a resource to our customers to help them manage their utility bills in every season. Customers are encouraged to explore our bill management and conservation resources.
Our Conservation and Customer Solutions experts are ready to provide customers with valuable insights into their household energy and water consumption, complete personalized home assessments, and share customized conservation tips. Additionally, customers may call Customer Service at 830.629.8400 for personalized assistance.
New Braunfels Utilities reviews the sufficiency of its rates, through the development of the annual financial operating, to forecast the revenue requirements needed to maintain NBU’s systems. As we all know, New Braunfels has continued to experience dramatic growth over the past several years. The increased growth has affected the capacity in NBU’s infrastructure, strained the NBU workforce, and changed customer expectations. In response, NBU has developed a capital improvement project designed to build and enhance necessary infrastructure to ensure that NBU is prepared to meet the community’s electric, water, and wastewater needs for generations to come.
NBU’s five-year capital plan includes the investment of $980 million into 156 capital improvement projects over the next five years. NBU’s rates are designed to cover the cost of providing essential services and upgrading existing infrastructure to support the needs of our growing community.
New Braunfels Utilities has historically charged amongst the lowest rates in our region until recently. Now, to address the expanding infrastructure needs as well as replace aging infrastructure, NBU must incorporate rate adjustments to help meet those needs and remain financially sound. Many of our neighboring communities can focus on a single line of business – like electricity or water. NBU provides three lines of business and must invest in capital improvement projects to meet the demand.
As a municipal utility, NBU does not have to pay investors. NBU will continue to put its customer’s needs first and bill customers for the cost of providing services – not to turn a profit.
You can email communications@nbutexas.com.
