Electric Rate Breakdown
Electric Rate Breakdown | New Braunfels Utilities
How Electric Rates Are Structured
Electric rates include a fixed customer charge and a per kilowatt-hour (kWh) charge. Together, these charges help recover the cost of operating, maintaining, and investing in the electric system that serves our community. These charges support everything from purchasing power to maintaining local infrastructure and ensuring service is available when you need it.
The table below shows a forecast of electric costs based on average usage. It breaks down the individual line items that make up the total electric rate, including generation, transmission, delivery, and other system-related costs.
This forecast is based on typical monthly usage and may change due to extreme weather conditions or energy market events.
|
Line Item |
May |
March Monthly Electric Bill |
June |
April Monthly Electric Bill |
|---|---|---|---|---|
|
Generation |
$.0480 |
$57.60 |
$.0580 |
$69.60 |
|
Transmission |
$.0172 |
$20.64 |
$.0172 |
|
|
Delivery Charge |
$.03016 |
$36.19 |
$.03016 |
$36.19 |
|
Replenish Reserves |
$.0075 |
|
$.0075 |
|
|
Per kWh Charge Total |
$0.1029 |
$0.1129 | ||
|
Electric Service Availability Charge |
$22.80 |
|
|
|
|
Total Bill* |
$146.23 |
|
*Based on an average usage of 1,200 kWh. The line items listed reflect the pending update to the NBU bill. This forecast is subject to change should there be an extreme weather and/or energy market event.
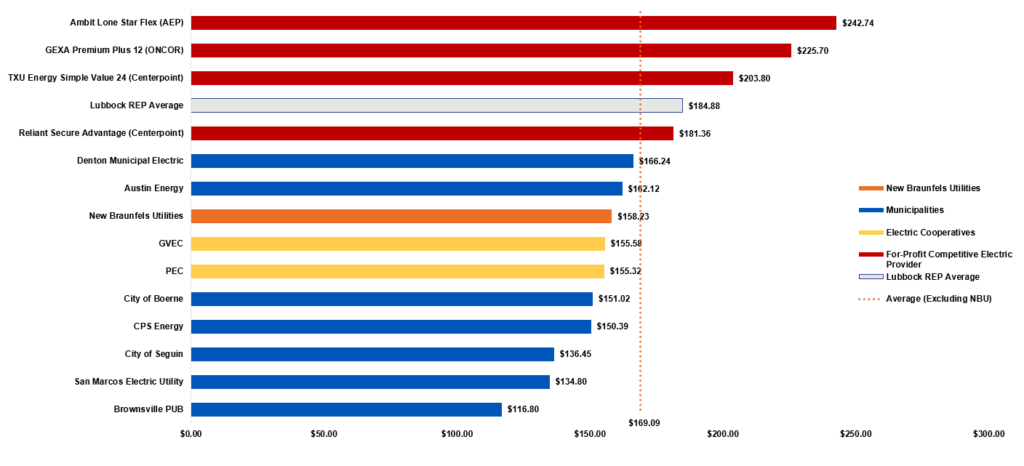
NBU Electric Rates Compared to Neighboring Utilities (June 2026)
Based on an average usage of 1,200 kWh.
Average Cost Per Kilowatt-Hour
The January 2026 average cost per kWh for residential customers is $.1129.*
The current 12-month average is $.1059 per kWh.