Your Rates At Work
Your Rates at Work | New Braunfels Utilities
Powering New Braunfels for You, Not Profit
Effective August 1, 2026, the second year of the two-year utility rate plan approved in June 2025 will take effect. This adjustment is part of a previously approved plan designed to provide a predictable approach to funding the infrastructure, maintenance, and services our community depends on while helping avoid larger, unexpected rate increases in the future.
Check out what your rates pay for, NBU Bill Explainer and access the Residential Rate Calculator tool. Additionally, flip through, or download our FY27 Rates Overview PDF.
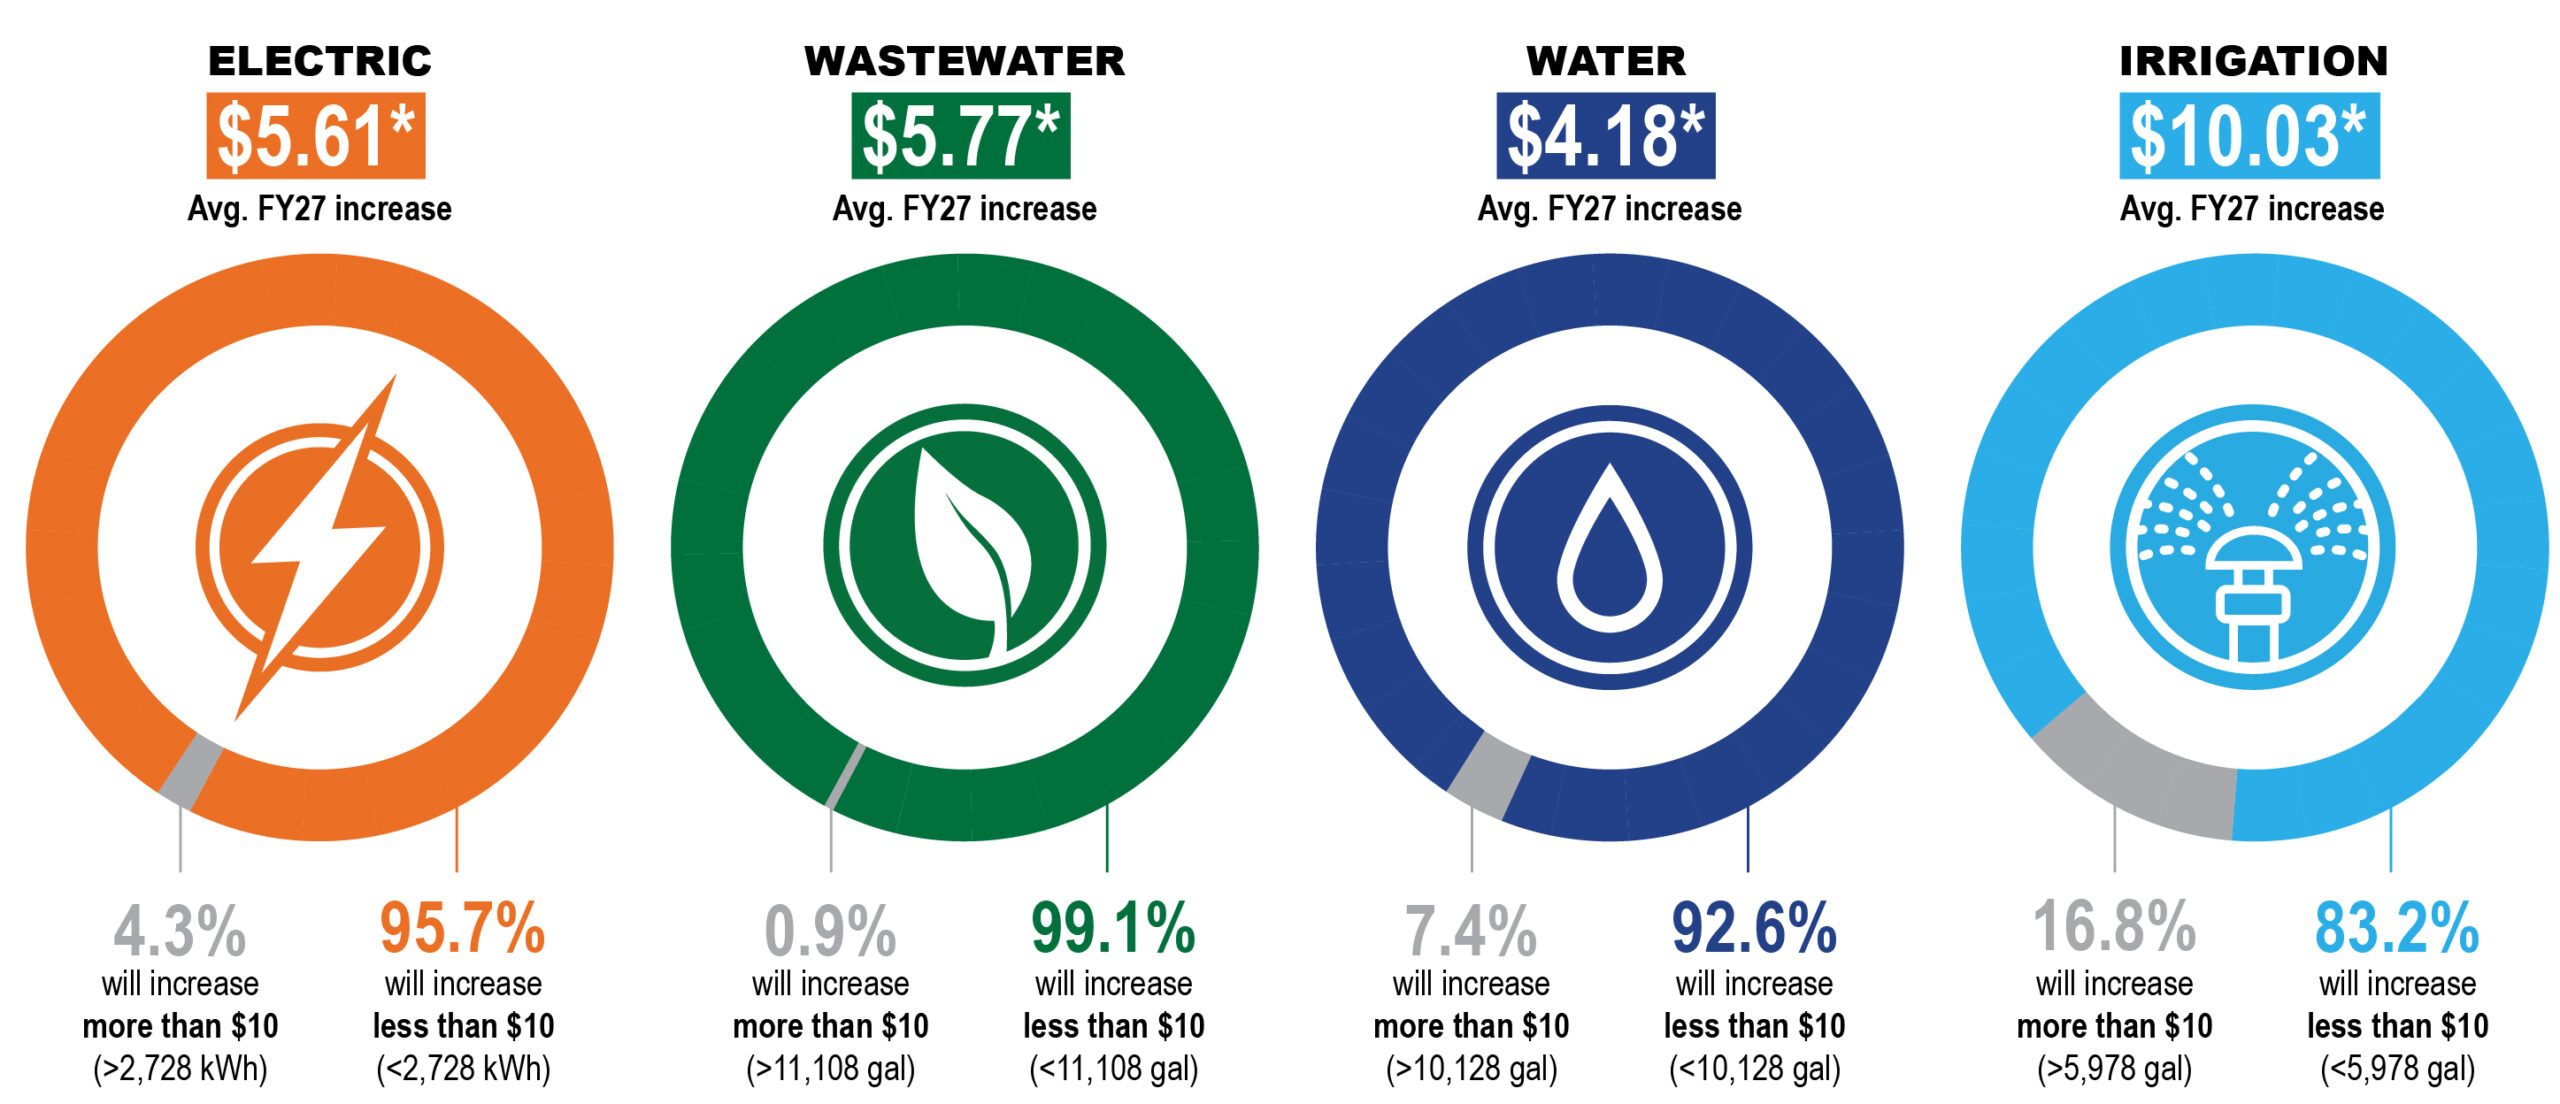
What This Means for the Average Bill
Rate changes affect customers differently based on usage. The visuals below show how electric, water and wastewater rate adjustments impact the average residential bill, including essential water use and irrigation.
*Monthly calculations use the following average customer usage profile: 1,200kwh/mo (electric) | up to 6,000 gal/mo (no irrigation) | up to 6,000 gal/mo (irrigation only) | 4,600 gal/mo (wastewater) – with higher costs in peak demand months due to increased usage. Click the image below to enlarge image.
How Our Rates Compare
Your monthly bill includes electric, water, wastewater, and City of New Braunfels solid waste and recycling services. To make comparisons easier, we break rates down by individual service so you can see how they stack up while still supporting well-maintained infrastructure and reliable service. For additional insight into specific charges on your bill, watch the explainer video below:
How Rates Are Set
We regularly review rates to ensure they reflect the actual cost of providing service. Rate adjustments are based on comprehensive rate studies conducted by independent experts and are reviewed through a public approval process. This helps ensure rates are fair, transparent, and aligned with long-term system needs.
What Your Rates Pay For
Utility rates fund several key areas that are essential to safety, reliability, and long-term service:
- Infrastructure
Ongoing maintenance and upgrades to electric, water, and wastewater systems. Keeping infrastructure in good condition protects public health and helps prevent service disruptions. - Growth
Utility projects required to serve new development in our service area. While developers pay impact fees, we are required to provide service, and planning ahead helps manage growth responsibly. - Regulatory Compliance
Meeting state and federal requirements for electric, water, and wastewater systems. These mandates are not funded by outside agencies and must be supported through rates. - Rising Costs and Planning Ahead
Increased costs for materials and labor, along with strategic investments to prepare for future growth and extreme weather.
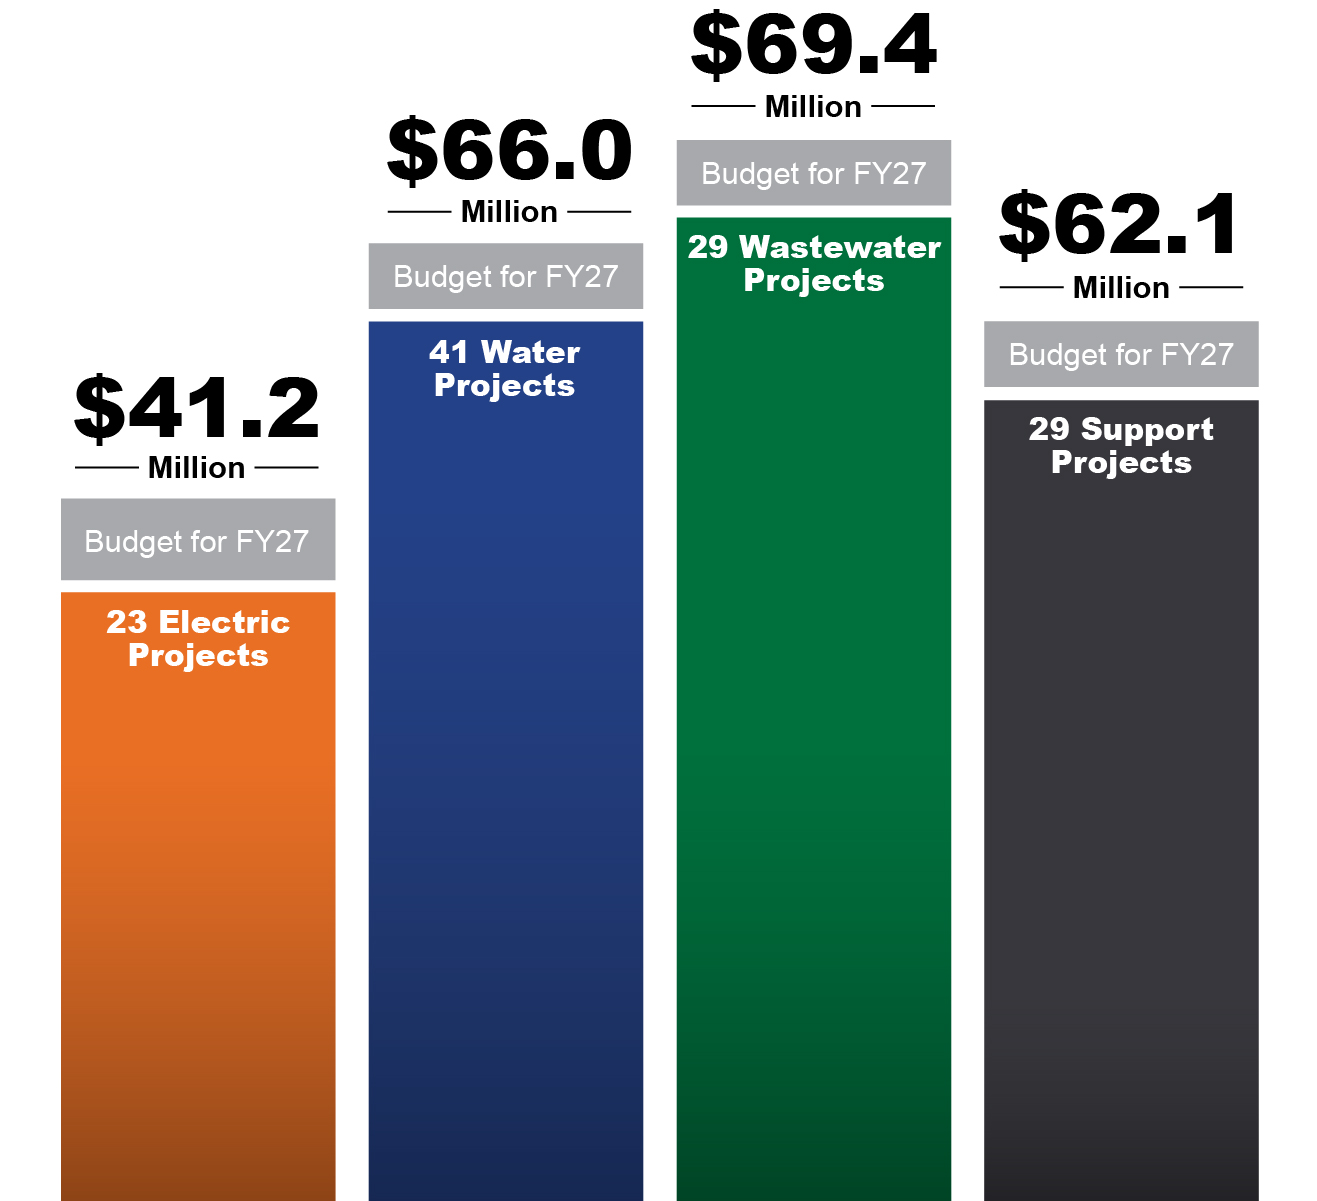
Key FY26-27 Capital Improvement Projects
Water Systems Investments
- SWTP Expansion Projected Cost $55.7M
- FM 1101 Pump Station Projected Cost $21.7M
- Solms Pump Station & Ground Storage Tank Projected Cost $20.6M
- FM 1044 Elevated Storage Tank Projected Cost $19.2M
- Water Tank Rehabilitations Projected Cost $18.8M
Wastewater System Investments
- McKenzie Water Reclamation Facility Expansion Projected Cost $53.6M
- Kuehler WFR Rehabilitation Projected Cost $47M
- McKenzie Interceptor Upgrade Projected Cost $45.9M
- Gruene Water Reclamation Facility Expansion Projected Cost $20.7M
- IH 35 Interceptor Upgrade Projected Cost $16.1M
Electric System Investments
- Kohlenberg Substation & Feeders Projected Cost $16.1 M
- Lone Oak Substation Projected Cost $11.4 M
- Hueco Springs Substation & Feeders Projected Cost $10M
- Aging Infrastructure, Distribution & Substation Projected Cost $18.4M
- System Extensions/Meters/Transformers Projected Cost $87.4M

Energy Cost Reduction Initiative
To support transparency and meet the requirements of House Bill 3693, we share our monthly utility costs across electric, water, and wastewater services. These costs reflect the equipment, facilities, and workforce needed to keep systems operating safely and reliably.
|
Month |
kWh |
KW |
Cost Per kWh |
Total Electric Cost* |
Gallons |
Cost Per Gallon |
Total Water Cost |
|
April 2025 |
2,158,085 |
5,331.61 |
$.104 |
$224,794.69 |
1,702,932 |
$.0103 |
$17,507.40 |
|
May 2025 |
2,337,892 |
5,917.18 |
$.104 |
|
4,382,544 |
$.0089 |
$38,857.95 |
|
June 2025 |
|
5,661.93 |
$0.104 |
$242,412.53 |
3,397,243 |
$0.0082 |
$27,728.92 |
|
July 2025 |
2,445,807 |
5,925.61 |
$0.110 |
$268,717.95 |
|
$0.0082 |
|
|
August 2025 |
2,944,557 |
5,883.69 |
$0.107 |
$313,987.33 |
|
$0.0077 |
$27,041.46 |
|
September 2025 |
|
6,023.37 |
$0.112 |
$309,183.42 |
3,366,802 |
|
|
|
October 2025 |
2,711,107 |
6,211.47 |
$0.114 |
$308,553.85 |
4,409,496 |
$0.0097 |
$42,876.28 |
|
November 2025 |
2,586,139 |
5,856.70 |
$0.107 |
$276,507.11 |
3,980,376 |
$0.0104 |
$41,288.52 |
|
December 2025 |
2,574,498 |
5,706.98 |
$0.104 |
$268,177.86 |
3,602,647 |
$0.0097 |
$34,852.46 |
|
January 2026 |
2,429,098 |
5,433.55 |
$0.105 |
$254,154.93 |
1,525,610 |
$0.0119 |
$18,145.07 |
|
February 2026 |
2,281,060 |
5,386.69 |
$0.107 |
$243,995.53 |
2,057,110 |
$0.0110 |
$22,662.79 |
|
March 2026 |
2,320,500 |
5,704.25 |
$0.108 |
$251,053.40 |
1,404,046 |
$0.0122 |
|
|
April 2026 |
2,475,466 |
5,456.67 |
$0.104 |
|
|
|
$35,521.33 |
|
|
|
|
|
|
|
|
|
|
June 2026 |
|
|
|
|
|
|
|
*Total Electric Cost includes electric demand charges for Large General Service (LGS).
Who We Are
New Braunfels Utilities (NBU) is a nonprofit, community-owned utility delivering electric, water and wastewater services to 70,000+ customers. That means NBU only charges ratepayers what it costs to provide utility services, no more. As a nonprofit utility, we serve you, not shareholders.
How we do it:
- Smart Planning
- Responsible Budgeting
- Excellence in Service
Why we do it: We are customer-driven and community-focused. We are not only NBU employees, we are your neighbors.
What Your Rates Do
Every dollar on your utility bill helps keep daily life moving — lights on, water flowing, and wastewater systems working safely. Behind the scenes, that requires extensive infrastructure and ongoing investment.
As a community-owned utility, the revenue collected through rates is reinvested directly into electric, water, and wastewater systems that serve homes and businesses across our community.
There are no shareholders. Every dollar supports operations, maintenance, infrastructure, and long-term planning focused on reliability, safety, and sustainability.
We’re a nonprofit utility providing electric, water, and wastewater services to more than 70,000 customers. We only charge what it costs to deliver service. There are no shareholders. Everything we collect goes back into the systems that serve our community.
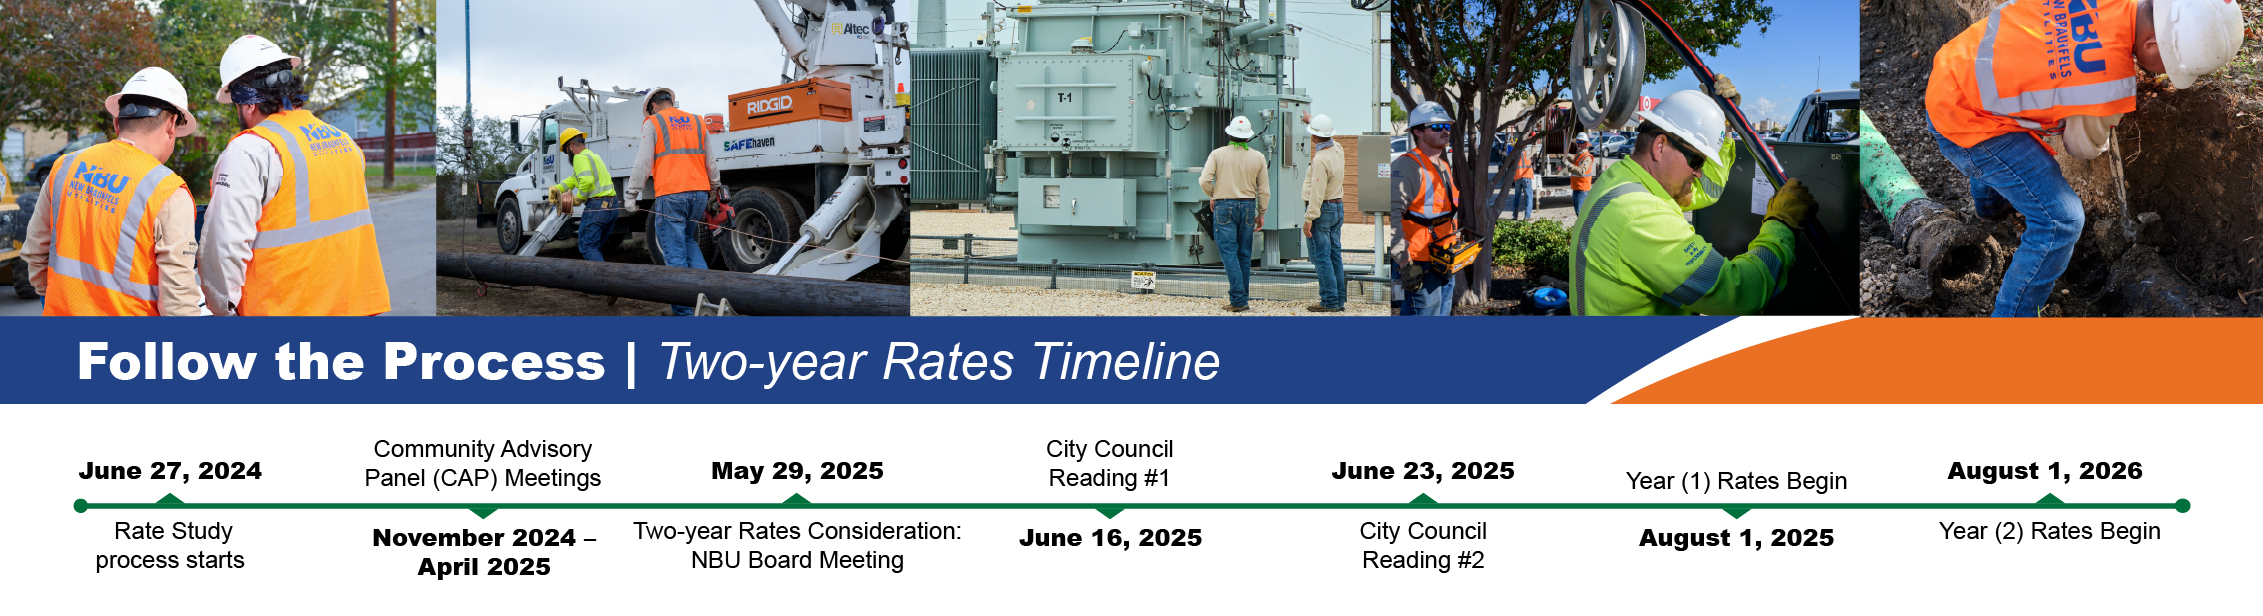
Rates Timeline
A two-year timeline of the rates setting process. Click the image below to enlarge.